
Linux strace command is used to debug and troubleshoot commands and executables by providing detailed information about the process execution. The strace command simply intercepts and records the system calls called by process or threads.
Install strace Command
The strace command is installed by default for some popular Linux distributions by default. But in some cases of software selections, it may not be installed by default. The strace can be installed for Ubuntu, Debian, Mint, Kali, Fedora, CentOS, and RHEL like below.
Ubuntu, Debian, Mint, Kali:
$ sudo apt install straceFedora, CentOS, RHEL:
$ sudo dnf install stracestrace Help Information
As a low-level command, the strace provides a lot of features and related helpful information. The -h option can be used to list help information.
$ strace -h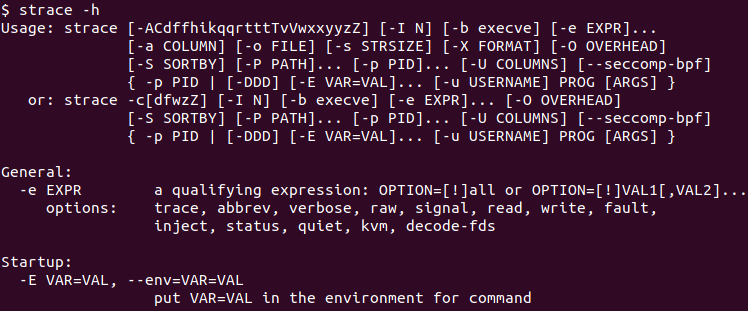
Trace Linux Command System Calls
The command we want to troubleshoot or debug is provided as a parameter to the strace command. The command may also have options that can be also added to the command. The syntax of the strace command for trace command is like below.
strace STRACE_PARAMETERS COMMAND COMMAND_PARAMETERS- STRACE_PARAMETERS is zero or more parameters belonging to strace command.
- COMMAND is the command we want to trace.
- COMMAND_PARAMETERS is zero or more parameters belonging to COMMAND.
In the following example, we trace the ls command which also has the option -l .
$ strace ls -l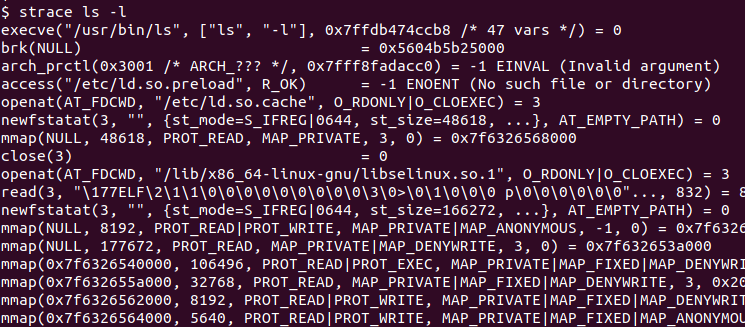
From the output, we can see that every system call is listed with the related information and system call parameters.
Trace Running Process with Process ID
Another useful feature of the strace command is the ability to attach to an existing or running process and debug it. In order to trace a running process, the process ID should be provided with the -p option to the strace command. If the process is owned by other than the current user the sudo should be used to get the required privileges. In the following example, we debug the process with ID 956758
$ sudo strace -p 956758If the process is owned by the current user we can omit the sudo like below.
$ strace -p 956758List Summary and Syscalls For A Process
The strace generates a lot of output related to system calls like time percentage, time as seconds, call count, etc. All of the can be listed in a summarized way as a table with the -c option like below.
$ strace -c ls -l% time seconds usecs/call calls errors syscall ------ ----------- ----------- --------- --------- ---------------- 23.91 0.008719 54 159 write 22.88 0.008346 46 179 179 getxattr 18.73 0.006832 43 158 158 lgetxattr 18.45 0.006728 42 158 statx 3.66 0.001336 38 35 17 openat 2.18 0.000795 33 24 close 2.08 0.000759 31 24 newfstatat 1.81 0.000661 18 35 mmap 1.28 0.000466 29 16 read 1.23 0.000449 56 8 mprotect 0.54 0.000196 49 4 4 connect 0.52 0.000190 47 4 socket 0.40 0.000146 73 2 getdents64 0.35 0.000129 43 3 lseek 0.29 0.000106 53 2 munmap 0.26 0.000095 47 2 2 statfs 0.21 0.000078 39 2 ioctl 0.21 0.000076 25 3 brk 0.21 0.000075 37 2 rt_sigaction 0.14 0.000051 25 2 1 arch_prctl 0.13 0.000046 46 1 prlimit64 0.12 0.000043 21 2 1 access 0.11 0.000040 40 1 futex 0.10 0.000038 38 1 rt_sigprocmask 0.10 0.000037 37 1 set_robust_list 0.10 0.000036 36 1 set_tid_address 0.00 0.000000 0 6 pread64 0.00 0.000000 0 1 execve ------ ----------- ----------- --------- --------- ---------------- 100.00 0.036473 43 836 362 total
Print Instruction Pointer For System Call
The strace command can print the instruction pointer for every system call. The -i option is used to add instruction pointer information in every instruction call at the start of the output line.
$ strace -i ls -l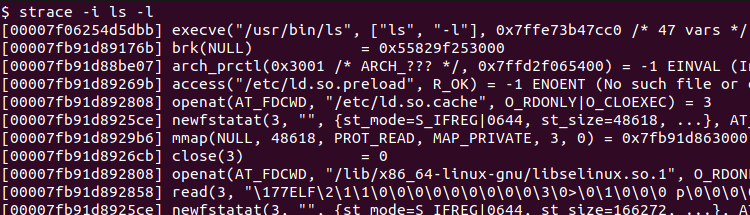
Show Time Information for Trace Output
The strace can also display time information like hour:minute:second for every system call. The -t option is used to display time information for every call like below.
$ strace -t ls -l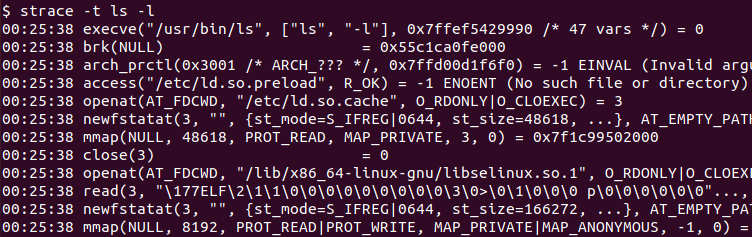
Display Time Spent for System Calls
Every system call uses some time from the CPU time. This time spent information for the CPU time can be displayed with the -T option like below.
$ strace -t ls -l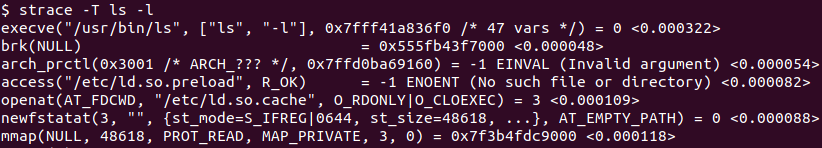
Trace Specific System Calls
One of the most powerful features of the strace is the ability to trace specific system calls. This helps a lot in the troubleshooting process as only interested system calls can be listed. :In the following example we only trace the openat system call. The -e trace= option is used to specify the system call we want to trace.
$ strace -e trace=openat ls -l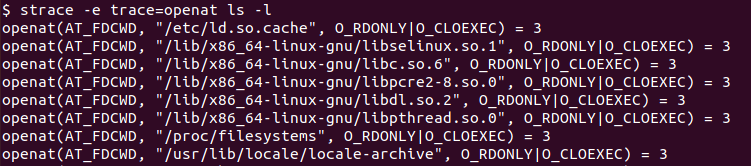
Save Trace Output To A File
The strace command creates a lot of output as every system call is printed by default. This output can be stored into a file that stays the terminal clean and able to read or investigate output later. The -o option is used to store strace output into a file where the file name is also provided. In the following example, we store the strace output into a file named ls_debug.txt file.
$ strace -o ls_debug.txt ls -l