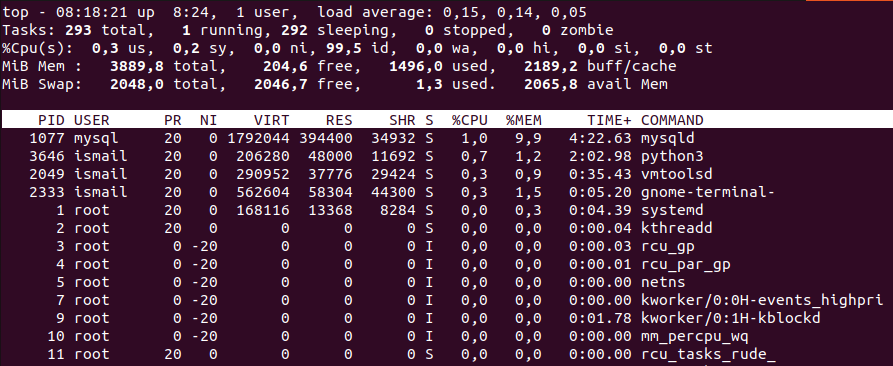
Linux top command is used to monitor system resources and usage in an elegant way by using the terminal or command line interface. The top command mainly lists the processes and related resource usage like CPU, Memory, etc. The process CPU usage may provide lots of detailed information like interrupts, cache usage, etc which can be easily listed, sorted, or monitored by using the top command. In this tutorial, we examine the CPU usage monitoring with the top command in detail.
List Processes by CPU Usage Percentage
When we start the top command the processes are listed with lots of information like users, memory usage, CPU usage percentage, etc. The default sorting metric is the CPU usage percentage. We can see it in the %CPU column and the process list is updated 2 seconds intervals according to the CPU usage for the last 3 seconds.
$ top
List Processes For Specific User Owner
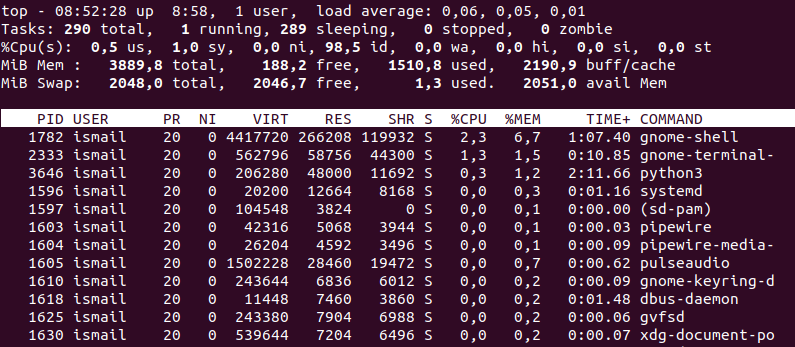
We can list a specific users process according to its CPU usage by providing the user name and filtering it. The -u option is used to filter specific users.
$ top -u ismail
List System CPU Core/Threat Usage
We can list the CPU usage for separate cores on the top interactive screen. Press 1 in order to list all CPUs and their CPU usage information. This information is listed at the top of the process list below.

Export/Save CPU Usage To A File
We can save the list of the CPU to a file easily by redirecting the information into a file. In the following example, we put the process list with the CPU usage information into the file named top_cpu.txt .
$ top -n 1 -b > top_cpu.txtWe can print the file with the cat command like below.
$ cat top_cpu.txt
