Linux operating system manages and uses different system resources. The memory or RAM is one of the most important system resources where every running process, command, service, the job requires and uses some memory. So a typical system has a lot of processes and services it uses and manages a lot of memory. A typical system administrator should monitor and manage memory usage for the Linux servers. Some applications may use a lot of memory even non-existing memory for specific time periods. Hopefully, Linux provides a lot of different ways and commands in order to check and monitor memory/RAM usage. The ram usage can be checked via a command or file or GUI tool.
top Command
The top command is the most popular command used to monitor and check Linux system resources. The top command is installed default by most of the Linux distributions like Ubuntu, Debian, Mint, Kali, Fedora, CentOS, RHEL, SuSe, etc. It provides information about CPU, Memory, Disk usage, and their details. The memory usage can be checked with the top command easily. The top command is an interactive command which provides and refreshes up-to-date information. The top command can be started like below.
top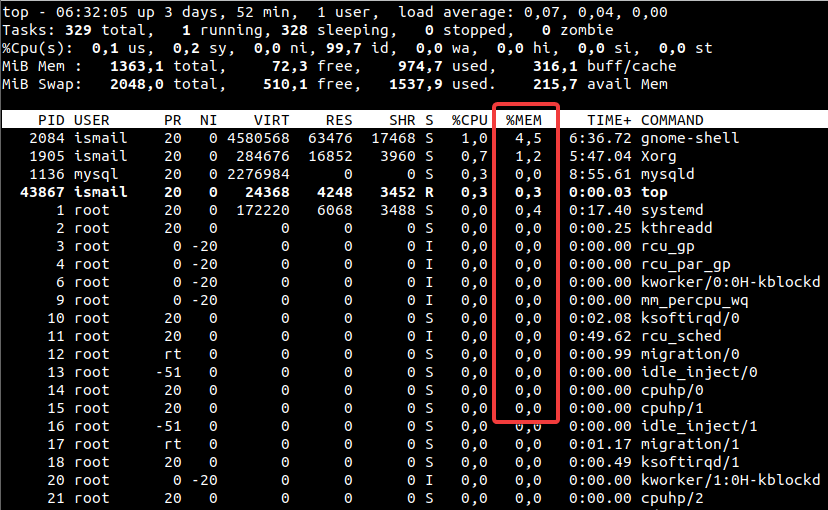
From the screenshot, we can see that the %MEM column shows the memory usage percentage. For example, if we have 10GB memory %4,5 memory usage is about 450 MB memory. The top command interactively updates this memory information and may change during the time with lower and higher values.
The processes can be sorted according to their memory usage by pressing the m key. Alternatively, the top command can be started with the -o %MEM option which sorts processes according to their memory usage by default.
top -o %MEM/proc/meminfo File
Linux provides the memory related information via the /proc/meminfo file. This file provides very raw information for the all memory related information. The Linux kernel provides this information and most of the commands use this information. The /proc/meminfo is a text based file and can be read with a text editor or printed to the bash shell easily with the cat command.
cat /proc/meminfoMemTotal: 1395848 kB MemFree: 162336 kB MemAvailable: 220464 kB Buffers: 10428 kB Cached: 133860 kB SwapCached: 26968 kB Active: 345624 kB Inactive: 321896 kB Active(anon): 254744 kB Inactive(anon): 270296 kB Active(file): 90880 kB Inactive(file): 51600 kB Unevictable: 16 kB Mlocked: 16 kB SwapTotal: 2097148 kB SwapFree: 521984 kB Dirty: 0 kB Writeback: 0 kB AnonPages: 496536 kB Mapped: 71848 kB Shmem: 1764 kB KReclaimable: 89116 kB Slab: 246712 kB SReclaimable: 89116 kB SUnreclaim: 157596 kB KernelStack: 12064 kB PageTables: 18612 kB NFS_Unstable: 0 kB Bounce: 0 kB WritebackTmp: 0 kB CommitLimit: 2795072 kB Committed_AS: 5245848 kB VmallocTotal: 34359738367 kB VmallocUsed: 39732 kB VmallocChunk: 0 kB Percpu: 105472 kB HardwareCorrupted: 0 kB AnonHugePages: 0 kB ShmemHugePages: 0 kB ShmemPmdMapped: 0 kB FileHugePages: 0 kB FilePmdMapped: 0 kB HugePages_Total: 0 HugePages_Free: 0 HugePages_Rsvd: 0 HugePages_Surp: 0 Hugepagesize: 2048 kB Hugetlb: 0 kB DirectMap4k: 483200 kB DirectMap2M: 999424 kB DirectMap1G: 0 kB
As we can see from the output the “cat /proc/meminfo” command provides a lot of and detailed information about the memory.
free Command
The free command can be also used to check and monitor memory usage. It is very simple when compared with other commands. The free displays the total amount of free and used memory and swap memory with buffer and cache information. The free command gathers information from the /proc/meminfo file.
free total used free shared buff/cache available
Mem: 1395848 1000480 98904 1780 296464 219948
Swap: 2097148 1572348 524800We can see the actual RAM or memory information is printed in the line Mem and swap information is printed in the second line with the Swap.
By default free command checks memory usage as byte but we can change the format into the megabyte with the -m option like below. The megabyte format is a lot easier to read and understand.
free -m
vmstat Command
The vmstat command is used to report information about the process, memory, paging, disk, etc. The vmstat command can be also used to check and monitor memory usage. If the vmstat executed without an option the average memory usage from the start of the system is printed.
vmstat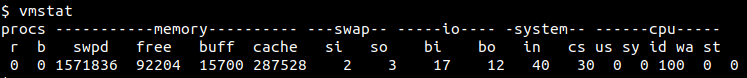
From the output we can see that there are detailed information about the memory usage like swapped, free, buffered and cached.
- swpd: the amount of virtual memory used.
- free: the amount of idle memory.
- buff: the amount of memory used as buffers.
- cache: the amount of memory used as cache.
- inact: the amount of inactive memory. (-a option)
- active: the amount of active memory. (-a option)
Alternatively, the vmstat can be run interactively by specifying the interval. This interactive mode displays and updates information for every interval average. In the following example, the vmstat runs interactively and updates memory usage information every 5 seconds.
vmstat 5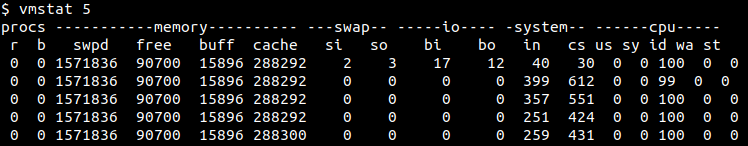
htop Command
The htop is an alternative to the top command in order to check and monitor memory usage. the htop provides more attracting displays which are colored with some basic graphic components. The memory usage is displayed with the usage percentage as a number and with bard graphics for the command line interface or bash. But the htop command is not installed by default and can be installed like below.
Ubuntu, Debian, Mint, Kali:
sudo apt install htopFedora, CentOS, RHEL:
sudo dnf install htophtop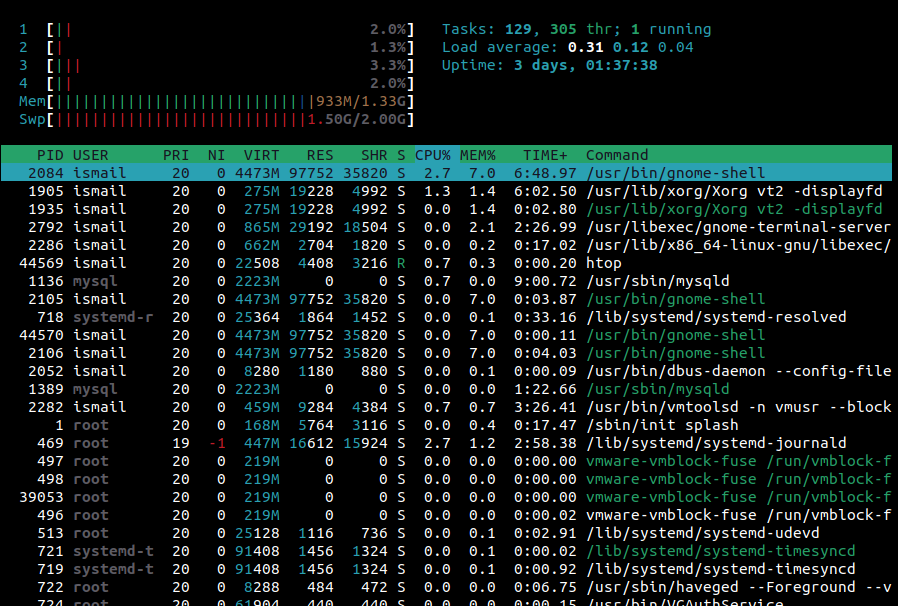
nmon Command
The nmon command is another command with a graphical display for memory usage. It provides the memory usage as well as
Ubuntu, Debian, Mint, Kali:
sudo apt install nmonFedora, CentOS, RHEL:
sudo yum install nmonIn order to start nmon first run the nmon command.
nmon To display and check memory-related information in the default nmon screen type m key which starts the memory screen.
m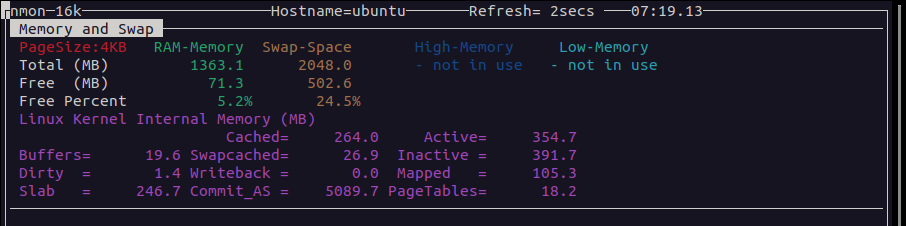
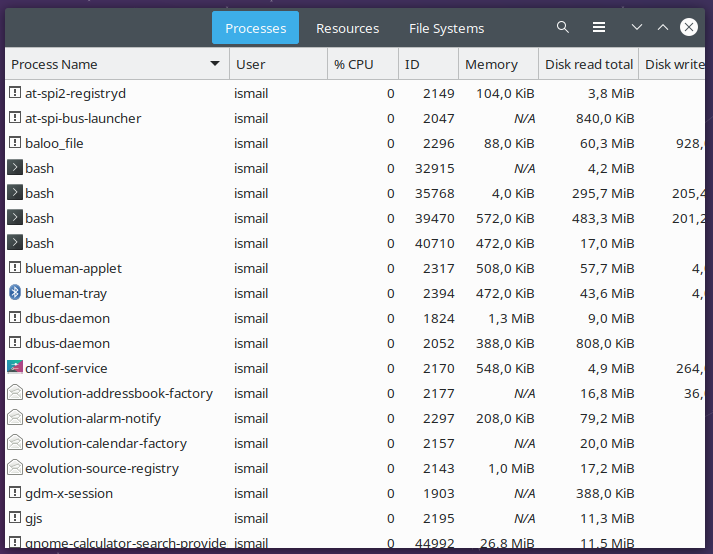
Resouce Monitor GUI
Every Linux desktop environment provides some GUI or desktop tool to show, check and monitor resource usage. The memory can be checked via these tools. Even these tools are not so detailed they provide process-based memory usage and the ability to sort these processes according to their memory usage. These tools are generally called “System Monitor” and can be opened via the Show Applications.