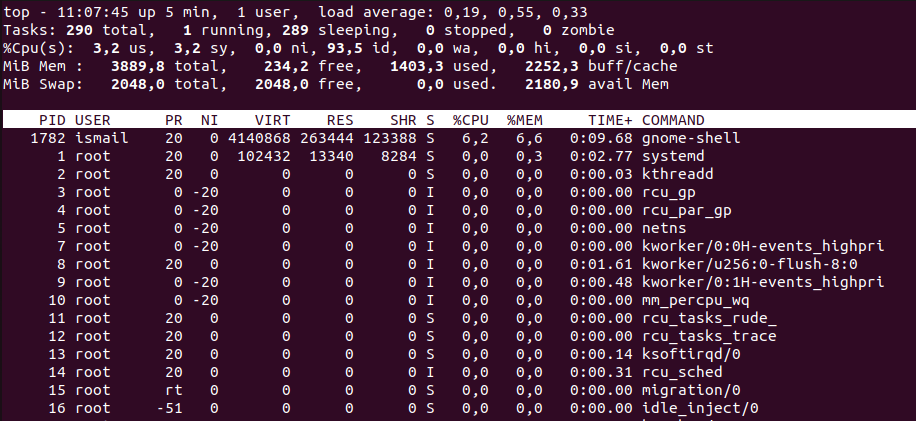
Linux provides the top command in order to display system resource usage according to the CPU, process, memory, user, disk, etc. One of the most popular features is the ability to list processes according to their memory usage. In this tutorial, we examine how to use the top command to monitor Linux system memory usage according to process, user, child process, etc.
top Command
The top command provides an interactive interface to list current memory usage. We can just run the top command which displays the dashboard with the memory usage information. Below we see the default screen of the top command.

top Command Memory Information
By default, the top command provides the following memory usage information.
- VIRT is the total virtual memory used by the current process. The value is represented as bytes.
- RES is the total actual memory used by the process and displayed with the byte unit.
- SHR is the total amount of memory shared with the other processes and displayed as bytes.
- %MEM is the percentage of the memory used by the process
Sort By Memory Usage
By default, the top command lists the processes according to their CPU usage. But we can change this and sort the processes according to their memory usage.
- SHFT+F to open the parameter screen
- Click on the %MEM to sort by process memory usage.
Alternatively, we can sort by memory by providing the -o option the %MEM to sort by memory usage directly via the command line interface.
$ top -o %MEMFilter By User
the processes can be filtered according to the user and sorted by the memory. The -u option is used to provide the username we want to filter.
$ top -u ismailThen use the following steps to sort by the memory for the specified user.
- SHFT+F to open the parameter screen
- Click on the %MEM to sort by process memory usage.
